One of the most popular features in NovoPsych is the graphing of score histories. This is particularly helpful when showing clients the progress they have made over the course of treatment as the visual representation tends to be easily interpreted.
Assessments designed to monitor psychological symptoms of clients will automatically graph results over time. If you administer the assessment to the same client more than once it will graph the results. To check if the particular assessment you’re using has graphing functionality you can quickly administer the assessment twice to a dummy client and review the results.
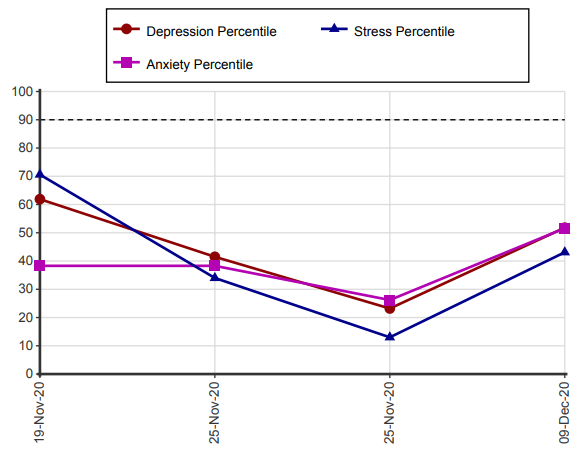
Below is an example of how the DASS-21 is graphed over four test administrations.
If you need to save these trends as a PDF, there is a guide for this here. You can also export a CSV version of the results here.