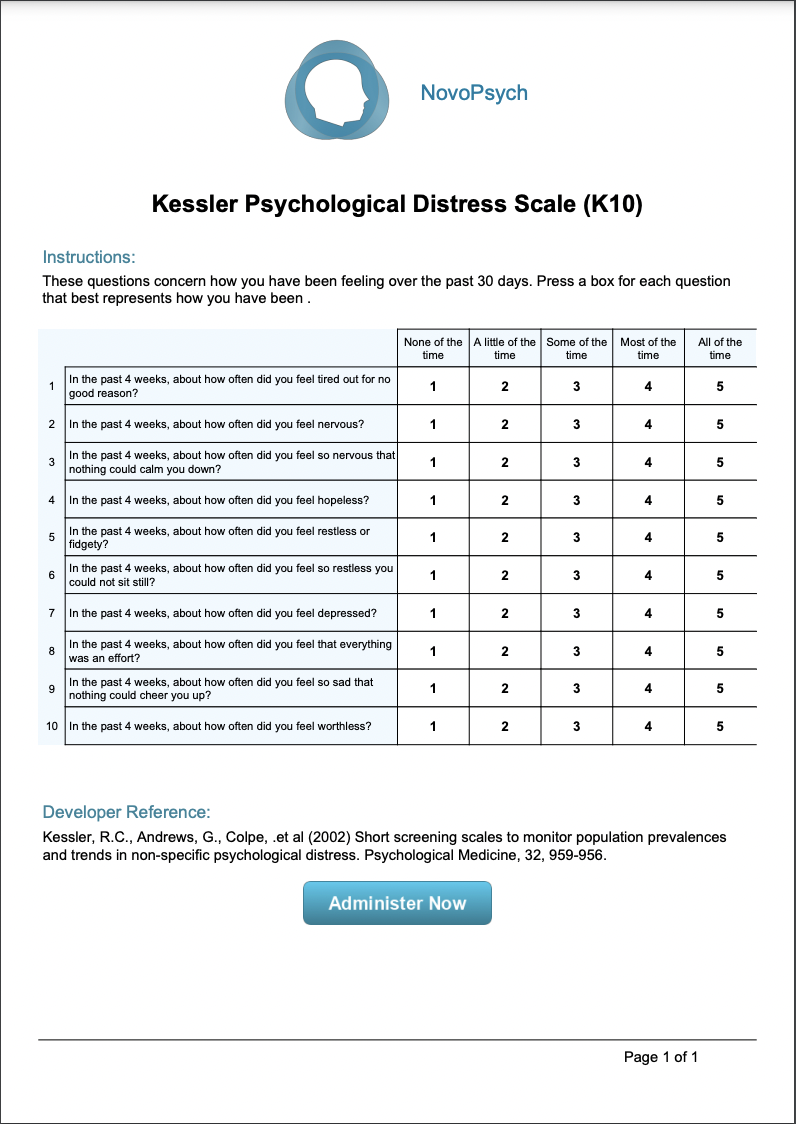
The K10 is often interpreted using a single total score. In addition the scale can be used to delineate between Depression and Anxiety symptoms. The K10 is a useful measure to track symptom progression during the course of treatment.
The K10+ is also available, which is a 14 question version of the K10, with the addition of four questions asking about the impact of the distress on daily living.
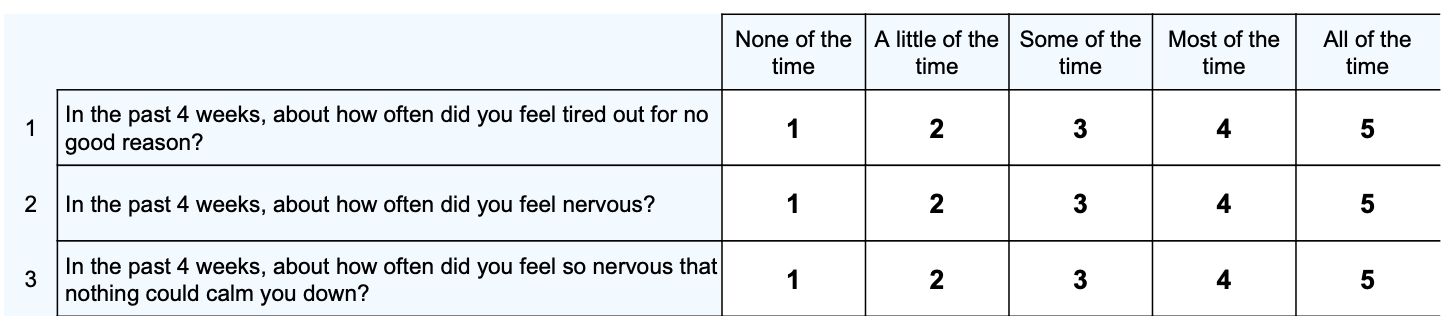
Scores range from 10 to 50 with higher scores indicating a higher severity of psychological distress.
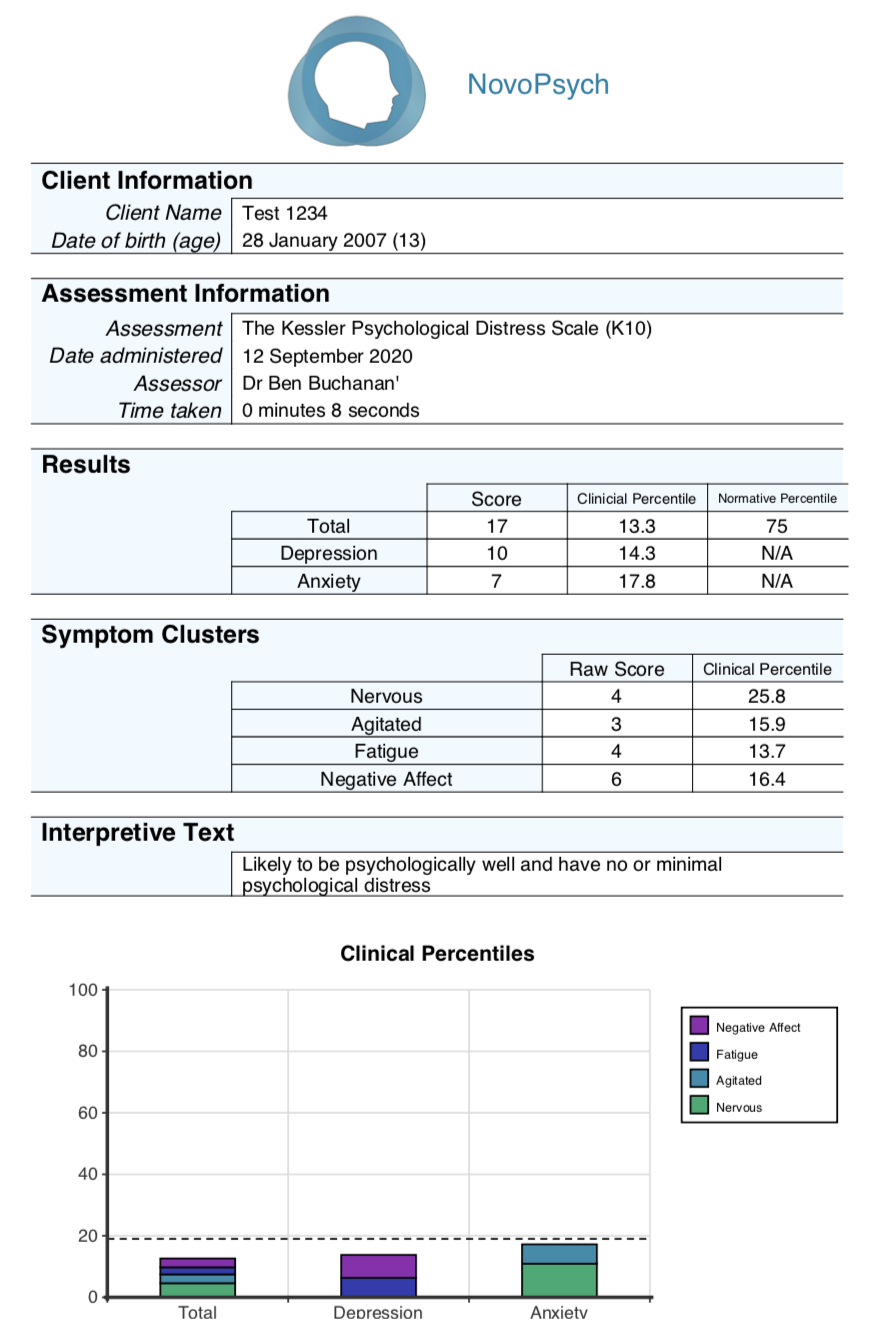
Percentiles are also presented, comparing scores against clinical and normative samples. A Clinical Percentile of around 50 is indicative of typical symptoms for those presenting for psychological treatment, and corresponds to a percentile of 95 on the normative sample.
Total scores can be split into four levels of severity:
The two main subscale scores are also presented:
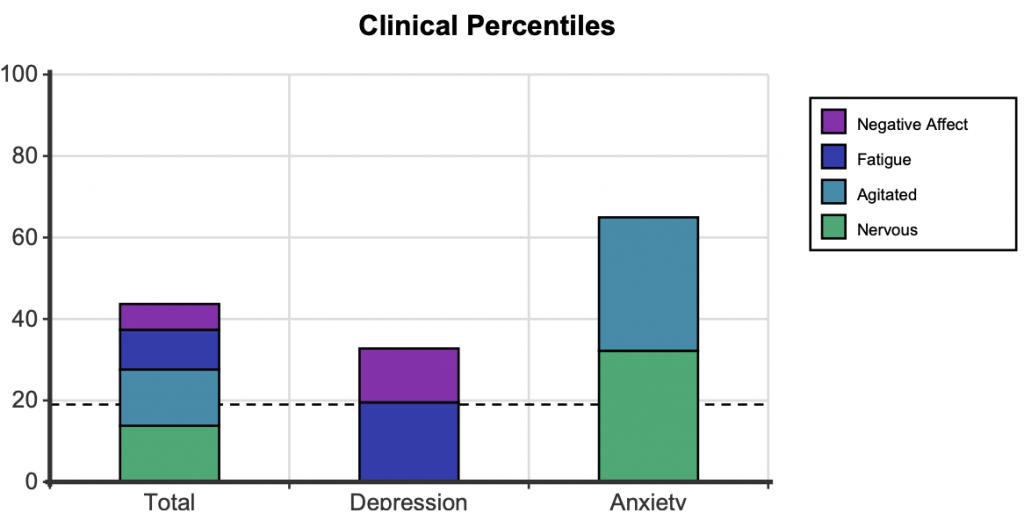
In addition, scores and clinical percentiles are also presented for four first order factors, showing the specific makeup of a patient’s psychological distress.
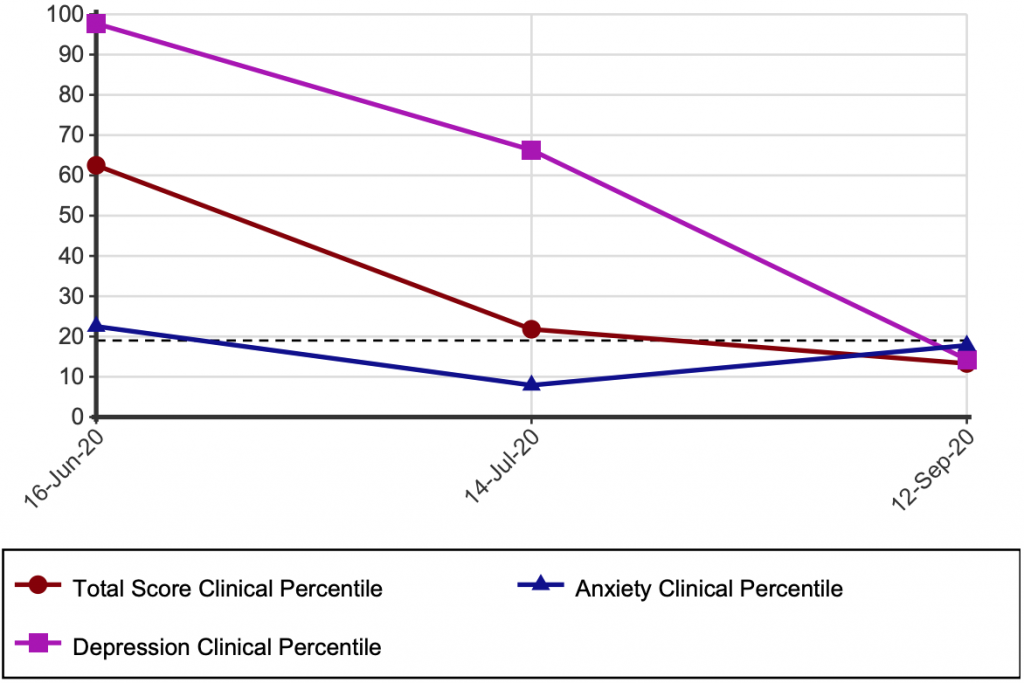
When administered on multiple occasions scores are graphed over time against Clinical Percentiles. The Y axis is from 0 to 100, and represent the percentile rank compared to other individuals seeking psychological intervention. For example, a percentile of 50 would represent the typical score for someone seeing a psychologist. Any scores above the dotted line at the 19th percentile indicate scores in the “clinical range”, while those below indicate no or minimal distress.
The K10’s psychometric properties has been extensively established. K10 scores have strong association between CIDI (WHO Composite International Diagnostic Interview) diagnosis of anxiety and affective disorders. There is a lesser but significant association between the K10 and other mental disorder categories and with the presence of any current mental disorder (Andrews & Slade, 2001).
Sensitivity and specificity data analysis also supports the K10 as an appropriate screening instrument to identify likely cases of anxiety and depression in the community and to monitor treatment outcomes. Normative data in an Australian sample was collected showing a mean score of 14.5 among a non-clinical community population (Slade, Gove & Burgess, 2010).
While the total score of the K10 has been the conventional method for scoring, factor analysis has found four district clusters of symptoms, with two second order factors (Brooks, Beard & Steel, 2006):
Data compiled by NovoPsych (n = 25,171) shows the average score for someone seeking psychological treatment in Australia is 27.1 (SD= 9.1), with a Depression subscale mean of 16.6 (SD = 6.2) and Anxiety mean of 10.5 (SD = 3.8). This data is used to generate Clinical Percentiles.