The Kessler Psychological Distress Scale Plus (K10+) is a 14-question psychological screening tool designed to identify adults with significant levels of psychological distress, and has the same first 10 questions as the K10, with the addition of four questions asking about the impact of the distress on daily living.
The K10 is a useful measure to track symptom progression during the course of treatment. It is widely used in Australia and often used in primary care settings to identify people with clinically significant psychological distress. The K10 is typically interpreted using a single total score of psychological distress, a broad concept characterised by unpleasant feelings or emotions that people may experience as overwhelming. Psychological distress is associated with a wide array of mental health concerns and diagnoses.
Example K10+ items:
The K10 can be used to identify more specific symptoms, including the capacity to delineate between Depression and Anxiety. The K10 is organised into four first-order factors and two second-order factors. The first-order factors are:
These first-order factors are grouped into two second-order factors:
Total Scores for the K10 range from 10 to 50 with higher scores indicating a higher severity of psychological distress.
Percentiles are used to compare scores against both normative community and clinical samples. The normative community percentiles contextualise scores in comparison to those typically found within the community. A percentile of 50 indicates average levels of psychological distress in comparison to Australian norms (Australian Bureau of Statistics, 2020-2022). A clinical percentile compares the respondent’s scores to other people seeking mental health support. A clinical percentile of 50 for the total score signifies typical symptom levels for individuals seeking psychological treatment, with a score within the “moderate” range. This raw score of 27 corresponds to a normative community percentile of 93.
The total scores are categorised using the following qualitative descriptors:
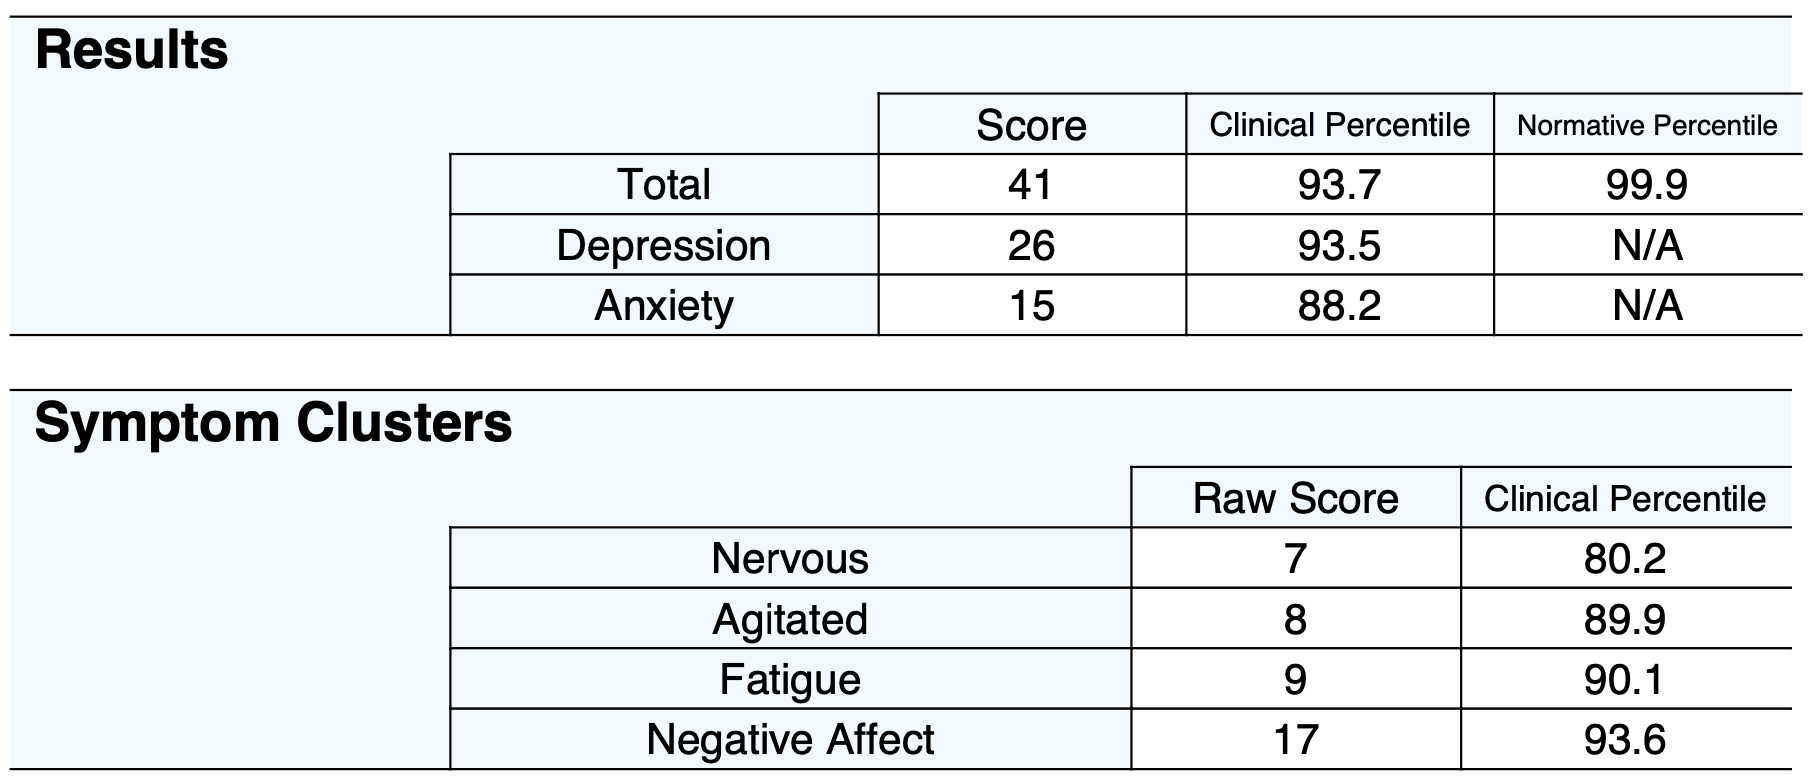
The two main subscale scores and clinical percentiles are presented:
In addition, scores and clinical percentiles are also presented for four first-order factors, showing the specific makeup of a patient’s psychological distress.
When administered multiple times, the total scores are graphed over time. A significant change in score is defined as an increase or decrease of at least 7 or more points for the total score. This criterion is based on the Reliable Change Index, as employed in studies involving Australian populations (Gonda et al., 2012; Rickwood et al., 2023). Such changes indicate significant improvement or reduction in symptoms, while a change of less than the specified points suggests no significant change in symptom severity between assessments.
People who score 20 or higher on the K10 are likely to meet the diagnostic criteria for a psychiatric disorder. Scores of 20 plus had a sensitivity to Major Depressive Disorder, Dysthymia, Generalised Anxiety Disorder, Panic Disorder, and Social Phobia ranging from 0.78 to 1 (Donker et al., 2009). Higher total scores on the K10 have been associated with reduced Global Assessment of Functioning (GAF) scores, social support and activity, increased functional impairments, and a higher physical health burden (Atkins et al., 2013). Individuals with high scores on the fatigue factor are more likely to experience physical impairments that affect their daily activities and overall physical functioning. Those with elevated scores on the negative affect factor often face a lower quality of life, reduced autonomy, and an increased risk of comorbid alcohol or other drug (AOD) issues (Brooks et al., 2006).
The K10’s psychometric properties have been extensively established. K10 scores have a strong association between CIDI (WHO Composite International Diagnostic Interview) diagnosis of anxiety and affective disorders. There is a lesser but significant association between the K10 and other mental disorder categories and with the presence of any current mental disorder (Andrews & Slade, 2001).
Sensitivity and specificity data analysis also supports the K10 as an appropriate screening instrument to identify likely cases of anxiety and depression in the community and to monitor treatment outcomes. Normative data in an Australian sample was collected showing a mean score of 14.5 among a non-clinical community population (Slade et al., 2010). While the total score of the K10 has been the conventional method for scoring, factor analysis has found four district clusters of symptoms, with two second order factors (Brooks et al., 2006):
Over a one-to-two-week testing interval, the K10 exhibited strong test-retest reliability, with an intraclass correlation coefficient (ICC) of .89 and a correlation coefficient (r) of .80 in treatment-seeking, and an ICC of .86 and r of .76 in non-treatment-seeking samples (Merson et al., 2021). The K10 demonstrated good convergent validity, with correlation coefficients of 0.63 or higher between the IPIP-NEO-120 Depression and Anxiety facets and both the K10 and its subscales (Lace et al., 2019).
Data compiled by NovoPsych (N = 25,171) shows the average score for someone seeking psychological treatment in Australia is 27.1 (SD= 9.1), with a Depression subscale mean of 16.6 (SD = 6.2) and Anxiety mean of 10.5 (SD = 3.8). This data is used to generate clinical percentiles, which helps contextualise results in comparison to other people seeking psychological support.
Normative community percentiles are derived through interpolation using data from the National Study of Mental Health and Well-Being (Australian Bureau of Statistics, 2020-2022). Using this data, NovoPsych derived percentile ranks across continuous score ranges, ensuring precise normative benchmarks for comparative purposes.
The first table illustrates the relationship between levels of psychological distress and corresponding score ranges, normative community percentiles, and clinical percentiles (See Table 1). It categorises psychological distress into four severity levels (subclinical, mild, moderate, and severe) and provides the associated score ranges and percentile rankings for both normative community and clinical samples.
Table 1. Severity Ranges and Corresponding Normative Community and Clinical Percentiles.
The second table illustrates how total scores (see Table 2) compare to the normative community and clinical samples (Australian Bureau of Statistics, 2020-2022). Each score is accompanied by a corresponding normative community and clinical percentile, indicating the percentage of individuals who scored the same or lower. For instance, a score of 16 falls at the 66th percentile in the normative community and the 11th percentile in the clinical sample. This indicates that 66% of people in the normative community group and 11% of people in the clinical group scored 16 or lower. These graphs are instrumental in contextualising an individual’s total scores on the K10, providing a clearer understanding of their standing relative to other individuals in the community and to those seeking mental health support.
Table 2. K10 Total Score Normative Community and Clinical Percentiles.
The third table illustrates subscale scores compared to the clinical sample (see Table 3).
Table 3. Subscale Clinical Percentiles.
Kessler, R. C., Andrews, G., Colpe, L. J., Hiripi, E., Mroczek, D. K., Normand, S.-L. T., Walters, E. E., & Zaslavsky, A. M. (2002). Short screening scales to monitor population prevalences and trends in non-specific psychological distress. Psychological Medicine, 32(6), 959–976. https://doi.org/10.1017/S0033291702006074
Andrews, G., & Slade, T. (2001). Interpreting scores on the Kessler Psychological Distress Scale (K10). Australian and New Zealand Journal of Public Health, 25(6), 494–497. https://doi.org/10.1111/j.1467-842X.2001.tb00310.x
Atkins, J., Naismith, S. L., Luscombe, G. M., & Hickie, I. B. (2013). Psychological distress and quality of life in older persons: relative contributions of fixed and modifiable risk factors. BMC Psychiatry, 13(1), 249–249. https://doi.org/10.1186/1471-244x-13-249
Australian Bureau of Statistics. (2020-2022). National Study of Mental Health and Wellbeing. ABS. https://www.abs.gov.au/statistics/health/mental-health/national-study-mental-health-and-wellbeing/latest-release.
Brooks, R. T., Beard, J., & Steel, Z. (2006). Factor Structure and Interpretation of the K10. Psychological Assessment, 18(1), 62–70. https://doi.org/10.1037/1040-3590.18.1.62
Donker, T., Comijs, H., Cuijpers, P., Terluin, B., Nolen, W., Zitman, F., & Penninx, B. (2010). The validity of the Dutch K10 and extended K10 screening scales for depressive and anxiety disorders. Psychiatry Research, 176(1), 45–50. https://doi.org/10.1016/j.psychres.2009.01.012
Gonda, T., Deane, F. P., & Murugesan, G. (2012). Predicting clinically significant change in an inpatient program for people with severe mental illness. Australian and New Zealand Journal of Psychiatry, 46(7), 651–658. https://doi.org/10.1177/0004867412445527
Lace, J. W., Greif, T. R., McGrath, A., Grant, A. F., Merz, Z. C., Teague, C. L., & Handal, P. J. (2019). Investigating the factor structure of the K10 and identifying cutoff scores denoting nonspecific psychological distress and need for treatment. Mental Health & Prevention, 13, 100–106. https://doi.org/10.1016/j.mhp.2019.01.008
Merson, F., Newby, J., Shires, A., Millard, M., & Mahoney, A. (2021). The temporal stability of the Kessler Psychological Distress Scale. Australian Psychologist, 56(1), 38–45. https://doi.org/10.1080/00050067.2021.1893603
Rickwood, D., McEachran, J., Saw, A., Telford, N., Trethowan, J., & McGorry, P. (2023). Sixteen years of innovation in youth mental healthcare: Outcomes for young people attending Australia’s headspace centre services. PloS One, 18(6), e0282040–e0282040. https://doi.org/10.1371/journal.pone.0282040
Slade, T., Grove, R., & Burgess, P. (2011). Kessler Psychological Distress Scale: Normative Data from the 2007 Australian National Survey of Mental Health and Wellbeing. Australian and New Zealand Journal of Psychiatry, 45(4), 308–316. https://doi.org/10.3109/00048674.2010.543653
NovoPsych’s mission is to help mental health services use psychometric science to improve client outcomes.
© 2023 Copyright – NovoPsych – All rights reserved