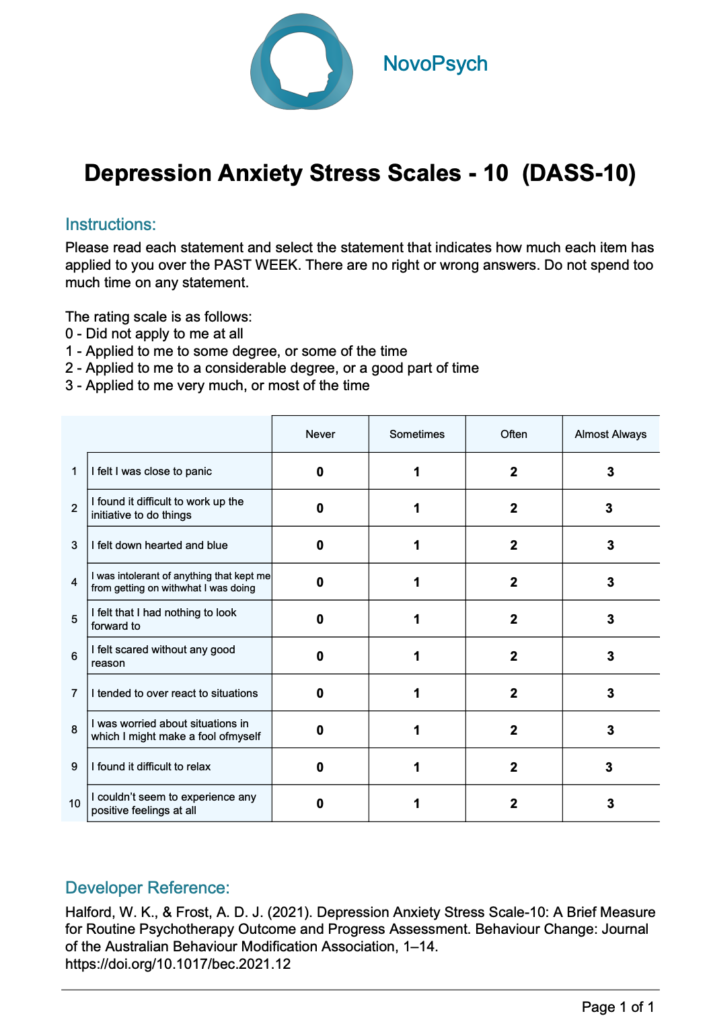
The scale was designed to be used for routine outcome monitoring in psychology practices and other mental health settings. It provides an overall level of distress that is sensitive to clinical change and can be used to track the effectiveness of treatment. It can be used with people 16 years and older.
The total score represents overall distress (0 to 30), with higher scores indicating more severe distress or a greater number of symptoms. Two subscales are presented:
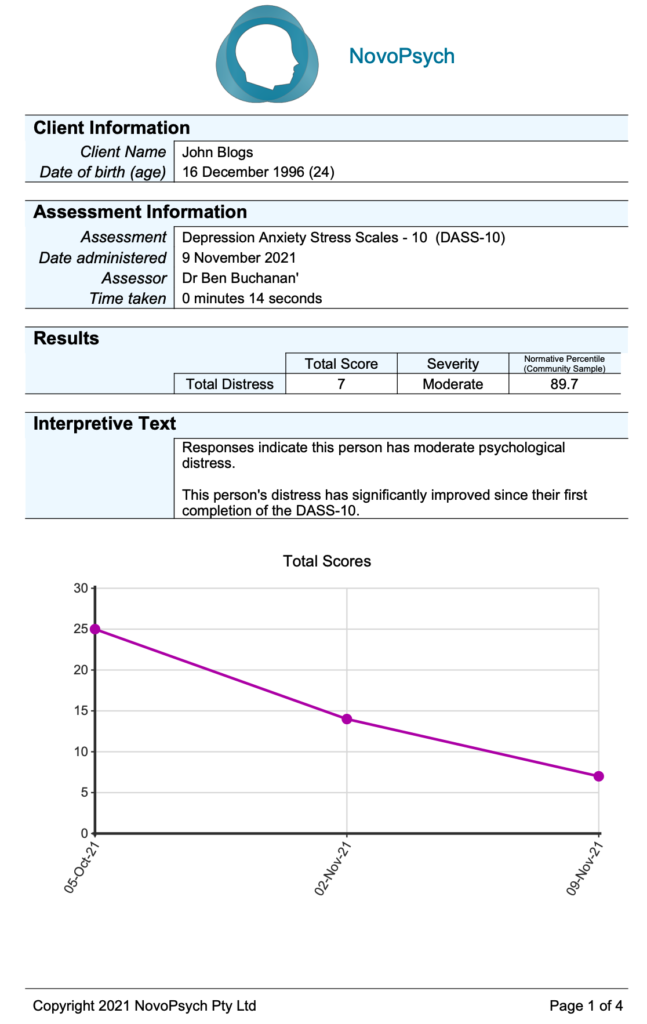
Overall scores can be classified into three severity groups:
A normative percentile is computed based on a community sample (Halford & Frost, 2021), indicating how the respondent scored in relation to a typical pattern of responding for adults. For example, a percentile of 83 or less indicates the individual has less distress than 83 percent of the normal population, and puts them in the mild/subclinical category. In mental health settings it is typical to see people with percentiles in the 90s.
In addition to the raw score being computed, average scores are calculated by dividing the raw score by the number of items, giving a sense of the general pattern of responding at the subscale level. Average scores are helpful for interpretation as they allow comparisons between total score and subscales. When administered more than once, average scores are graphed, showing the change in symptoms over time.
Based on reliable change calculations, interpretive text is provided describing the respondent’s change in symptoms from first to last administrations, as either having experinced:
Halford and Frost (2021) developed the DASS-10 as a shorter version of the original DASS-42 and DASS-21 (Lovibond & Lovibond, 1995). EFA and CFA yielded two highly correlated factors: Anxiety-Stress and Depression subscales. Both subscales and the higher-order Distress factor had high internal consistency (Cronbach’s alpha = 0.83, 0.85, & 0.89 respectively; Halford & Frost, 2021).
Based on the above psychometric properties, reliable change was determined to be a five or more point change between first and last DASS-10 administration.
As expected, the validation study found the DASS-10 was able to discriminate between populations, with a clinical sample scoring significantly higher (mean = 7.67, SD = 4.36) than a community sample (mean = 3.01, SD 3.15). The community sample of newly wedded couples (n = 376) can be used to compute normative percentiles.