The Flourishing Scale is a brief 8-item measure of the respondent’s self-perceived success in important areas of life such as relationships, self-esteem, purpose, and optimism.
The Flourishing Scale (FS) is an 8-item self-report measure designed to assess meaning and fulfilment in adults. The scale provides a single psychological well-being score that captures important aspects of human functioning including positive relationships, feelings of competence, having meaning and purpose in life, and engagement in activities.
The scale takes a broad approach to measuring well-being compared to scales focused solely on life satisfaction or positive emotions. It targets eudaimonic (associated with meaning), as opposed to hedonic (associated with pleasure) aspects of well-being in its assessment of psychological prosperity (Diener et al., 2010). The scale has been used with groups as young as 12 years old, but was originally validated in an adult population (Diener et al., 2010; Romano et al., 2020).
Higher scores on the FS have been associated with various indicators of well-being including optimism, happiness, and life satisfaction (Diener et al., 2010). The scale has also demonstrated relationships with significant life events, for example, veterans with service-related disabilities were observed to score significantly lower on the FS compared to those without service-related disabilities (Umucu et al., 2019).

The FS can provide valuable insights beyond traditional symptom-focussed measures that typically only assess distress or dysfunction. The FS captures positive aspects of psychological functioning that may remain impaired even after symptoms improve, such as meaning in life, social connectedness, and optimism about the future. Tracking FS scores over time is particularly valuable because it can demonstrate therapeutic progress in terms of positive gains rather than just symptom reduction – for example, a client’s depression symptoms might improve while their sense of purpose or quality of relationships remains low, suggesting additional therapeutic work is needed.
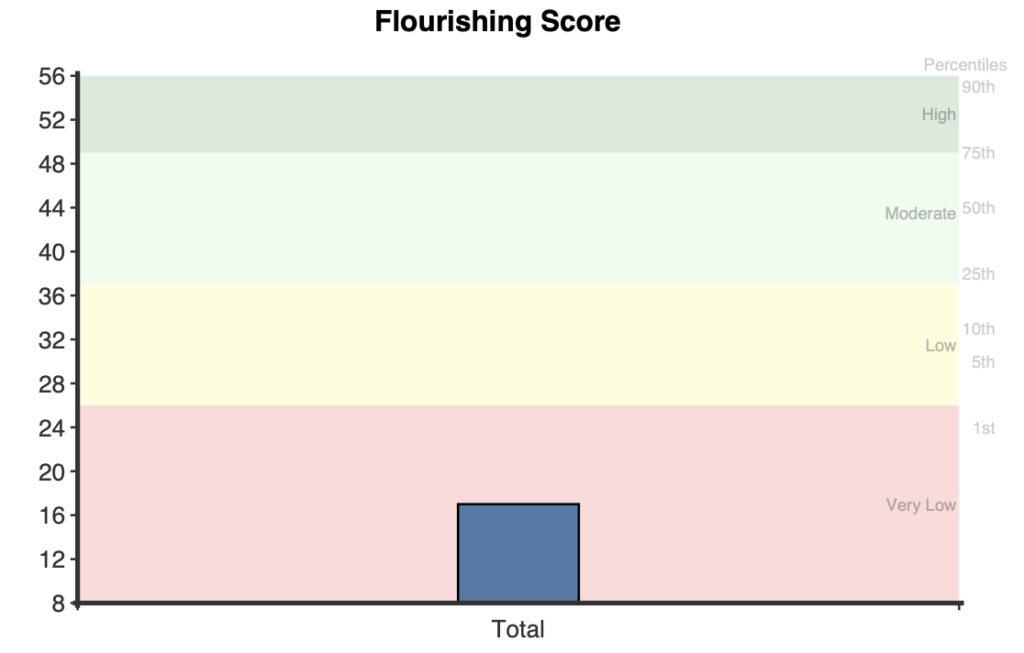
The FS total scores range from 8 to 56, with higher scores indicating greater meaning and fulfillment. High scores on the FS indicate that the client is experiencing strong positive functioning across multiple important life domains. Low scores on the FS indicate that the client is experiencing difficulties in several key areas of life functioning, such as feeling disconnected from a sense of purpose, struggling with social relationships, feeling disengaged from daily activities, and having a pessimistic view of their future.
Percentiles are calculated based upon internal NovoPsych data (n=2,186) and summed scores and their standard deviations from a national sample of New Zealand (Hone et al., 2014) that included 9,646 adults. Descriptors are also presented which are based upon score ranges within the community and clinical data:
· 50-56 (74th-93rd): High
· 38-49 (22nd-73rd): Moderate
· 27-37 (3rd-21st percentile): Low
· 8-26 (1st-2nd percentile): Very Low
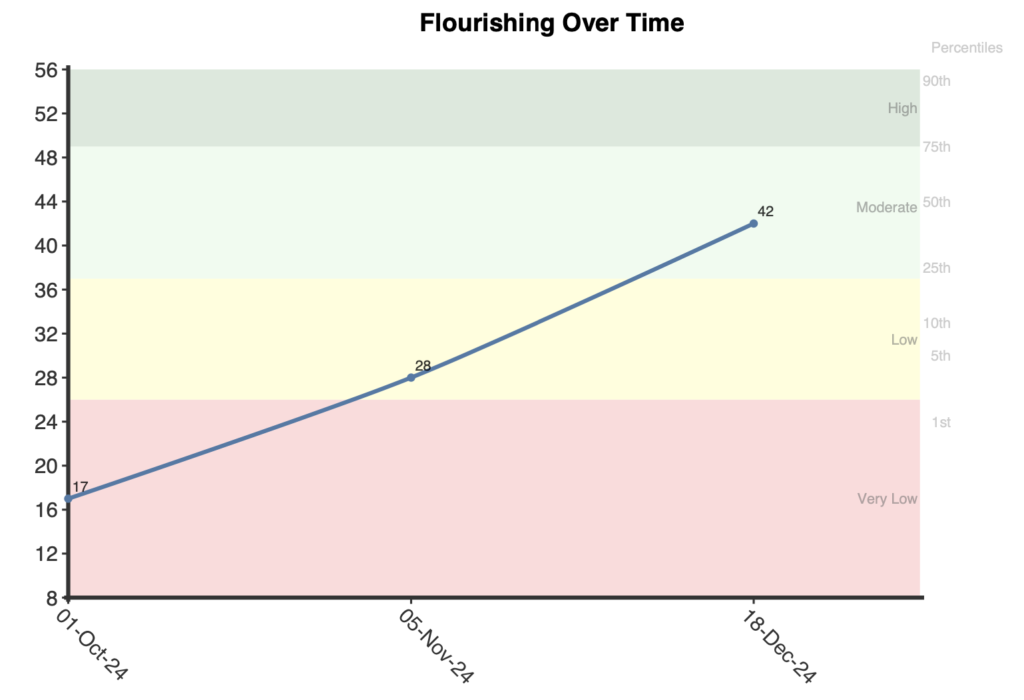
When used to monitor progress in therapeutic settings, changes of 4 or more points (approximately .5 SD in the community sample) can be considered meaningful, suggesting either improvement or deterioration in psychological well-being. This criterion is based upon the Minimally Important Difference (MID) calculation (Turner et al., 2010).
On first administration a bar graph is presented showing the total scores.

If administered multiple times, results are graphed to show changes over time, providing feedback on therapeutic progress.

The FS can be complemented by measures of emotional well-being or life satisfaction to provide a more comprehensive picture of well-being.
Examining individual item responses can provide clinically useful information about specific areas of strength or challenge. For example, low scores on “My social relationships are supportive and rewarding” helps to identify interpersonal relationships as a specific area for therapeutic focus.
The FS was originally introduced as the Psychological Well-Being scale in a book chapter (Diener et al., 2009), and was later renamed to the Flourishing Scale to better reflect its content. The scale was developed based on multiple theories of psychological well-being including self-determination theory and Ryff’s model of psychological well-being (Ryan & Deci, 2000; Ryff, 1989), as well as theories related to social relationships and purpose in life (Diener et al., 2010). The scale has been validated across diverse populations and cultural contexts, including adolescents, university students, working adults, older adults, and clinical populations. It has been translated and validated in multiple languages and countries including China, France, Iran, Italy, India, Japan, Portugal, Russia among others (Tong et al., 2017; Villieux et al., 2016; Fassih-Ramandi et al., 2020; Giuntoli et al., 2017; Singh et al., 2018; Sumi et al., 2014; Silva & Caetano et al., 2013; Didino et al 2019).
The FS has demonstrated strong psychometric properties across multiple studies and populations. The original validation study reported excellent internal consistency with a Cronbach’s alpha of .87 and test-retest reliability of .71 over a one-month period (Diener et al., 2010). Subsequent studies have consistently found high internal reliability, with alpha coefficients ranging from .83 to .95 across different cultural contexts and translations (Hone et al., 2014; Silva & Caetano, 2013; Sumi, 2014).
Factor analyses consistently support a unidimensional structure. The original study revealed one strong factor with an eigenvalue of 4.24, accounting for 53% of the variance, with factor loadings ranging from .61 to .77 (Diener et al., 2010). This single-factor structure has been replicated across various populations and cultural adaptations (Howell & Buro, 2015; Silva & Caetano, 2013; Umucu et al., 2019).
The scale has demonstrated good convergent validity, correlating positively with other well-being measures. Studies have found significant positive correlations with life satisfaction (r = .62 to .67), positive emotions (r = .58), and measures of psychological well-being (r = .63 to .67) (Diener et al., 2010; Romano et al., 2020). The scale also shows expected negative correlations with measures of depression, anxiety, and stress (Howell & Buro, 2015).
Measurement invariance has been established across gender, age, and various cultural contexts. Romano et al. (2020) demonstrated strict measurement invariance across gender and grade levels in a large adolescent sample, indicating that the scale measures the same construct across these groups. Cross-cultural studies have validated the scale’s use across multiple countries and languages while maintaining strong psychometric properties (Sumi, 2014; Tang et al., 2016).
The original study by Diener et al. (2010) reported a mean score of 44.97 (SD = 6.56) from a combined sample of university students. More recent normative data from a large nationally representative sample of New Zealand adults (n = 9,646, ages 18-110) found similar results with a mean score of 43.82 (SD = 8.36), with females scoring slightly higher (M = 44.33, SD = 8.07) than males (M = 43.30, SD = 8.63) (Hone et al., 2014).
Clinical norms estimated by NovoPsych (n = 2,186, mean age = 41 years) indicate substantially lower scores in a clinical population of therapy clients, with a mean of 33.77 (SD = 11.00). Female clients (M = 34.10, SD = 11.18) scored similarly to male clients (M = 33.75, SD = 10.91). Gender differences observed within community and clinical samples are minimal, and research suggests the scale possesses configural, metric and scalar invariance across gender. This indicates that differences (or lack thereof) are not attributable to gender-bias within items (Rando et al., 2022).
Based on these normative samples, percentiles can be calculated to aid interpretation:
Community Sample (n = 9,646):
· Raw score 50-56 = percentile 74-93
· Raw score 38-49 = percentile 22-73
· Raw score 27-37 = percentile 3-21
· Raw score 8-26 = percentile 1-2
Clinical Sample (n = 2,186):
· Raw score 50-56 = percentile 93-99
· Raw score 38-49 = percentile 61-92
· Raw score 27-37 = percentile 28-60
· Raw score 8-26 = percentile 1-27
Diener, E., Wirtz, D., Tov, W., Kim-Prieto, C., Choi, D. W., Oishi, S., & Biswas-Diener, R. (2010). New well-being measures: Short scales to assess flourishing and positive and negative feelings. Social Indicators Research, 97(2), 143-156.
Bartholomew, E., Hegarty, D., Smyth, C., Baker, S., Buchanan, B. (2024). A Review of the Flourishing Scale (FS): Clinical and Community Normative Data and Qualitative Descriptors.
Diener, E., Wirtz, D., Tov, W., Kim-Prieto, C., Choi, D., Oishi, S., & Biswas-Diener, R. (2010). New well-being measures: Short scales to assess flourishing and positive and negative feelings. Social Indicators Research, 97(2), 143-156. https://doi.org/10.1007/s11205-009-9493-y
Diener, E., Wirtz, D., Tov, W., Kim-Prieto, C., Choi, D. W., Oishi, S., & Biswas-Diener, R. (2010). New well-being measures: Short scales to assess flourishing and positive and negative feelings. Social Indicators Research, 97(2), 143-156. http://dx.doi.org/10.1007/s11205-009-9493-y
Hone, L. C., Jarden, A., Schofield, G. M., & Duncan, S. (2014). Measuring flourishing: The impact of operational definitions on the prevalence of high levels of wellbeing. International Journal of Wellbeing, 4(1), 62-90. http://dx.doi.org/10.5502/ijw.v4i1.4
Howell, A. J., & Buro, K. (2015). Measuring and predicting student well-being: Further evidence in support of the Flourishing Scale and the Scale of Positive and Negative Experiences. Social Indicators Research, 121(3), 903-915. https://doi.org/10.1007/s11205-014-0663-1
Rando, B., Abreu, A. M., & Blanca, M. J. (2023). New evidence on the psychometric properties of the Portuguese version of the flourishing scale: Measurement invariance across gender. Current Psychology, 42, 22450-22461. https://doi.org/10.1007/s12144-022-03325-2
Romano, I., Ferro, M. A., Patte, K. A., Diener, E., & Leatherdale, S. T. (2020). Measurement invariance of the Flourishing Scale among a large sample of Canadian adolescents. International Journal of Environmental Research and Public Health, 17(21), 7800. https://doi.org/10.3390/ijerph17217800
Ryan, R. M., & Deci, E. L. (2000). Self-determination theory and the facilitation of intrinsic motivation, social development, and well-being. American Psychologist, 55(1), 68-78.
Ryff, C. D. (1989). Happiness is everything, or is it? Explorations on the meaning of psychological well-being. Journal of Personality and Social Psychology, 57(6), 1069-1081.
Silva, A. J., & Caetano, A. (2013). Validation of the Flourishing Scale and Scale of Positive and Negative Experience in Portugal. Social Indicators Research, 110(2), 469-478. https://doi.org/10.1007/s11205-011-9938-y
Sumi, K. (2014). Reliability and validity of Japanese versions of the Flourishing Scale and the Scale of Positive and Negative Experience. Social Indicators Research, 118(2), 601-615. https://doi.org/10.1007/s11205-013-0432-6
Tang, X., Duan, W., Wang, Z., & Liu, T. (2016). Psychometric evaluation of the simplified Chinese version of Flourishing Scale. Research on Social Work Practice, 26(5), 591-599. https://doi.org/10.1177/1049731514557832
Turner, D., Schünemann, H. J., Griffith, L. E., Beaton, D. E., Griffiths, A. M., Critch, J. N., & Guyatt, G. H. (2010). The minimal detectable change cannot reliably replace the minimal important difference. Journal of Clinical Epidemiology, 63(1), 28-36. https://doi.org/10.1016/j.jclinepi.2009.01.024
Umucu, E., Grenawalt, T. A., Reyes, A., Tansey, T., Brooks, J., Lee, B., Gleason, C., & Chan, F. (2019). Flourishing in student veterans with and without service-connected disability: Psychometric validation of the Flourishing Scale and exploration of its relationships with personality and disability. Rehabilitation Counseling Bulletin, 63(1), 3-12. https://doi.org/10.1177/0034355218808061
NovoPsych’s mission is to help mental health services use psychometric science to improve client outcomes.
© 2023 Copyright – NovoPsych – All rights reserved