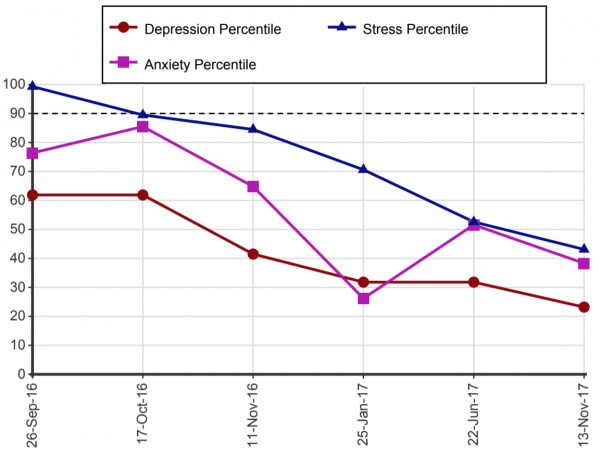
With NovoPsych you can graph results over time so you can visually monitor symptoms changing from session to session. All you need to do is administer the same assessment to a client more than once, and you’ll get a nice graph!
The most popular scales for outcome monitoring on NovoPsych are the DASS-21, K10, or CORE-10. I’d recommend having a look at all three and then choosing which one will suit you best, then be consistent with it. Personally, I administer the DASS-21 in session 1, 3, 6, and then every second session thereafter.

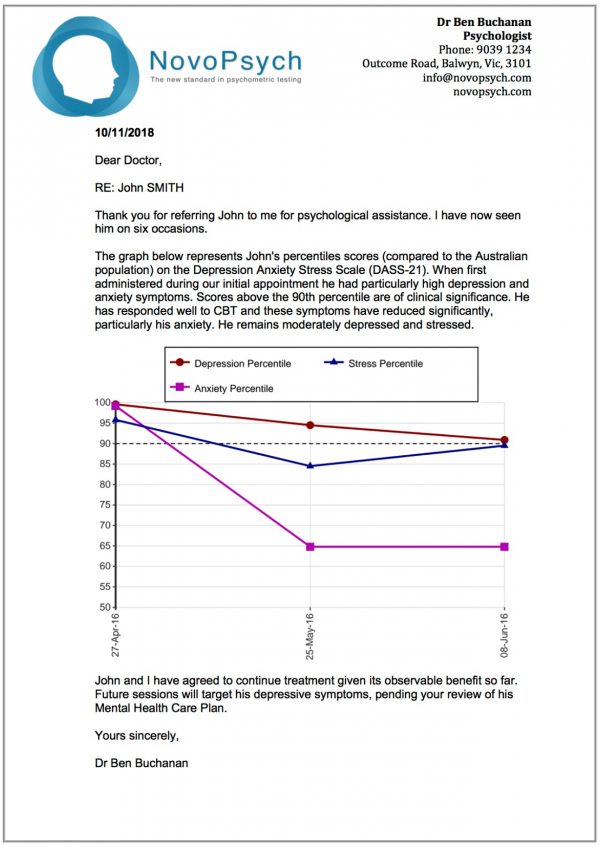
Many NovoPsych users take a screenshot of the graph and then include it in their letters to a referring GP.

Doctors appreciate receiving letters with graphs, because they can clearly see how the patient is tracking. Clients love it too, because graphing symptoms over time gives clients an objective representation of their distress and provides personalised evidence of the benefits of treatment. Moreover, research shows that regular use of outcome measures may increase engagement and improve the therapeutic relationship, thereby increasing the efficacy of treatment.
I hope find this information helpful!
Dr Ben Buchanan
BA (Hons), GradDipPsych, DPsych, MAPS
Co-founder & Director of NovoPsych Pty Ltd
[email protected]
www.NovoPsych.com
Psychologist

