The PHQ-9 is the nine item depression scale from the Patient Health Questionnaire, and is a widely used tool for assisting primary care clinicians in identifying depression as well as monitoring treatment (Kroenke et al., 2001).
The PHQ-9 is based directly on the diagnostic criteria for major depressive disorder in the Diagnostic and Statistical Manual (DSM) and asks about symptoms in the previous two weeks. The PHQ-9 is a widely used tool for screening, diagnosing, and monitoring depression in both clinical and non-clinical settings (Kocalevent et al., 2013). Clinically, it supports treatment planning and tracking changes in symptoms, while in non-clinical settings like schools or workplaces, it serves as an initial screening tool to identify individuals who may need further evaluation. The PHQ-9 is appropriate for individuals aged 13 years and older, making it suitable for adolescents and adults (Kroenke et al., 2001; Richardson et al., 2011).
Scores are categorised into the following ranges (Kroenke et al., 2001):
The PHQ-9 was created to provide a quick, reliable method for evaluating the presence and severity of depressive symptoms based on the criteria outlined in the DSM. Each of its nine items corresponds to one of the symptoms of major depression, and it allows for a severity score to aid in clinical decision-making (Kroenke et al., 2001).
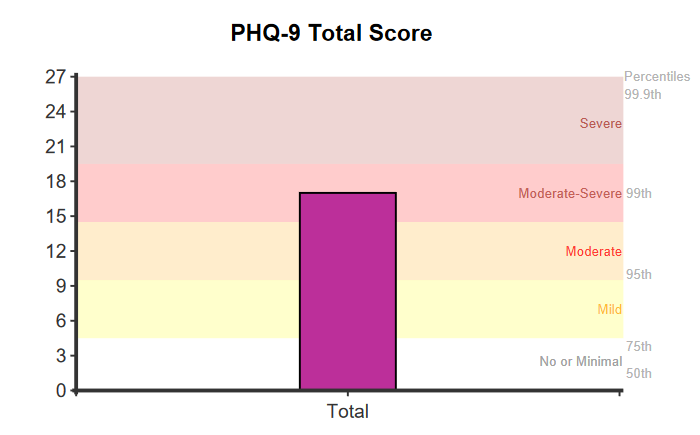
A raw score (from 0 to 27) is presented where higher scores indicate more depressive symptoms.

The scale classifies individuals into distinct severity categories based on their raw scores, as follows:

Percentiles are calculated and provide a useful context for comparing a respondent’s results with a normative community sample. A percentile of 50 represents typical patterns of responding, while higher percentiles represent higher levels of depressive symptoms. Percentiles of 76 and below corresponding to a raw score of 4, indicate no or minimal depressive symptoms (Kocalevent et al., 2013).

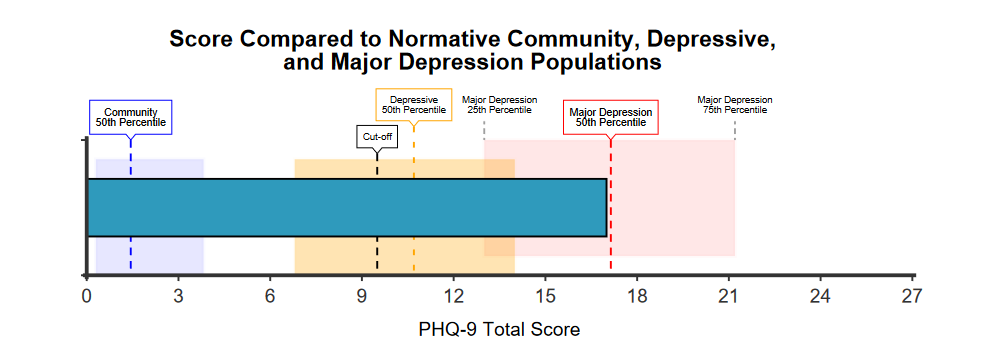
The horizontal graph presents the total score in comparison to individuals from the general population, individuals with major depression and people with a depressive disorder (other than major depression). Shaded areas are presented around the two middle quartiles (between the 25th and 75th percentile) (Kroenke et al., 2001; Kocalevent et al., 2013). The major depression distribution represents individuals diagnosed with major depression. The depressive distribution represents scores from individuals who have other depressive disorder, such as dysthymic disorder or adjustment disorder with depressed mood.
Scores of 10 or more have been shown to reliably predict major depression, with a sensitivity of 81.4%, meaning that 81.4% of individuals who truly have the condition score above this point. The Positive Predictive Value (PPV) is 92.2%, indicating that when a score is 10 or more, there is a 92.2% chance the individual actually has major depression (Urtasun et al., 2019).

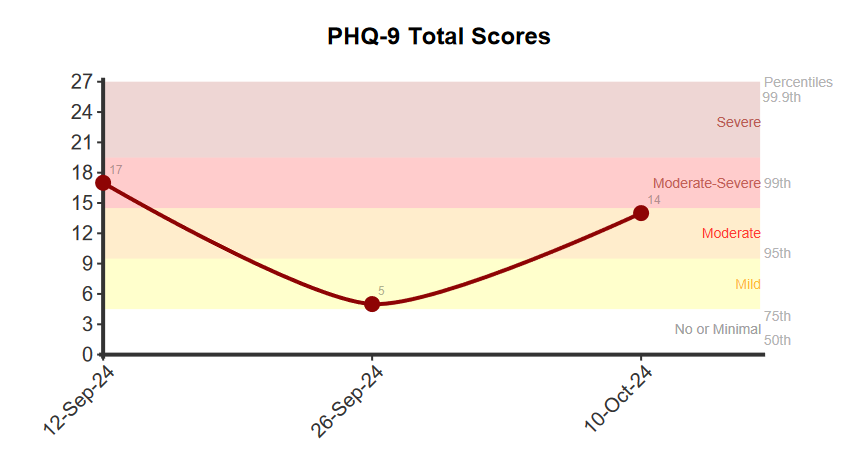
When using the PHQ-9 to track symptoms over time, a significant change in score is defined as an increase or decrease of 5 or more points. This criterion is based on the Reliable Change Index. Such changes indicate reliable and significant improvement or deterioration in symptoms.
Higher scores on the PHQ-9 indicate more severe depressive symptoms, which can be particularly concerning when coupled with comorbid mental disorders. Individuals with elevated PHQ-9 scores may experience intensified feelings of sadness, anxiety, or distress, making it more challenging to manage daily responsibilities and relationships (Johansson et al., 2013). This can lead to poorer life outcomes, such as increased absenteeism at work or school, greater difficulty in social interactions, and is associated with higher prevalence of substance use (Johansson et al., 2013). The PHQ-9 focuses on depressive symptoms and therefore does not detect other high prevalence disorders such as anxiety or general levels of psychological distress.
A recent study that employed a non-clinical sample of 58, 272 individuals from multiple countries (Mean age = 43, SD = 13, 63% female) found that the PHQ-9 consisted of a unidimensional structure and the general factor was found to be strong (e.g., factor loadings ranged from 0.725 to 0.893 in the pooled sample) (Bianchi et al., 2022).
To establish reliability and validity, the PHQ-9 was administered to 6,000 patients (pooled mean age = 38.5, SD = 14.32, 83% women) in 8 primary care clinics and 7 obstetrics-gynecology clinics, and construct validity and criterion validity were assessed against independent measures (Kroenke et al., 2001). Criterion validity was assessed against an independent structured mental health professional interview in a sample of 580 patients. The PHQ-9 demonstrates strong convergent validity, correlating with the Brief Beck Depression Inventory (r = 0.73, p <.0001) and the General Health Questionnaire (GHQ-12; r = 0.59, p <.0001). Divergent validity is indicated by a lower correlation with quality of life (EuroQOL; r = -0.50, p <.0001), suggesting a stronger link to mental health than general health perceptions (Martin et al., 2006).
The PHQ-9 also demonstrated excellent reliability, with a Cronbach’s alpha of 0.89, indicating strong internal consistency. Additionally, test-retest reliability over a 48-hour period yielded a correlation coefficient of 0.84, suggesting stability in repeated administrations (Kroenke et al., 2001).
Using a cut-off score of 10, the PHQ-9 performance in detecting depression varies by severity. For major depression, the sensitivity is 81.4%, meaning the PHQ-9 correctly identifies 81.4% of individuals who truly have the condition. The specificity is 89.6%, indicating that it accurately detects 89.6% of those who do not have major depression. The Positive Predictive Value (PPV) is 92.2%, suggesting that when the test indicates a positive result, there is a 92.2% chance the individual actually has major depression. The Negative Predictive Value (NPV) is 76%, implying that a negative result corresponds to a 76% likelihood that the person does not have the condition. For moderate depression, sensitivity increases to 90.6%, with a specificity of 84.5%, PPV of 85.6%, and NPV of 89.9% (Urtasun et al., 2019).
When using the PHQ-9 to track symptoms over time, a significant change in score is defined as an increase or decrease of 5 or more points. This criterion is based on the Reliable Change Index (McMillan et al., 2010) and determined using data from over 1,777 distinct episodes of care measured on NovoPsych between September 2014 and February 2022.
Two clinical samples are used by NovoPsych to contexualise results against individuals diagnosed with major depression and other depressive disorder (Kroenke et al., 2001):
Percentiles are produced based on a normative community sample consisting of 5,018 individuals from the general population (age range: 14-92 years, 53.6% female), representing a broad demographic distribution (Kocalevent et al., 2013). The study reported that 76.4% of the sample had a score of between 0 to 4, 18% had a score of between 5 and 9, 4.3% had a score of between 10 to 14, and 1.3% had a score of 15+. This data has been utilised by NovoPsych to model and interpolate percentiles for comparative analysis.
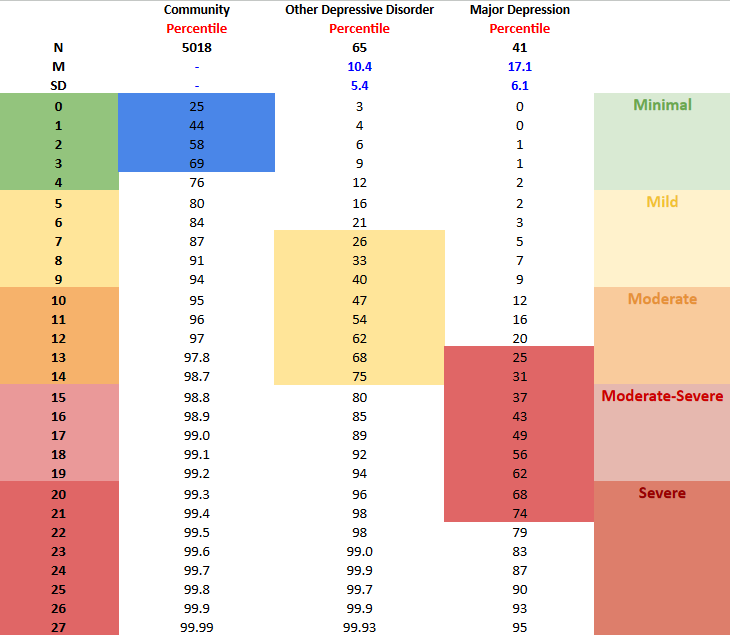
The percentile table below illustrates how total scores (see Table 1) compare to individuals in the community, individuals with other depressive disorder, and those with major depression (Kroenke et al., 2001; Kocalevent et al., 2013). Each score is accompanied by a corresponding percentile, indicating the percentage of individuals who scored the same or lower. For instance, a total score of 5 corresponds to the 80th percentile in the normative community sample, 16th percentile in the sample of people with other depressive disorder, and the 2nd percentile in the major depression sample (Table 1). This score signifies that 80% of the individuals in the general population had a score of 5 or lower, whereas only 2% of people with major depression. These graphs provide an understanding of a respondent’s standing relative to the normative community sample, those with other depressive disorder, and compared to individuals with major depression.
Table 1. PHQ-9 Total Score Normative Community, Other Depressive Disorder, and Major Depression Percentiles.

Kroenke, K., Spitzer, R. L., & Williams, J. B. W. (2001). The PHQ‐9. Journal of General Internal Medicine : JGIM, 16(9), 606–613. https://doi.org/10.1046/j.1525-1497.2001.016009606.x
Bianchi, R., Verkuilen, J., Toker, S., Schonfeld, I. S., Gerber, M., Brähler, E., & Kroenke, K. (2022). Is the PHQ-9 a Unidimensional Measure of Depression? A 58,272-Participant Study. Psychological Assessment, 34(6), 595–603. https://doi.org/10.1037/pas0001124
Johansson, R., Carlbring, P., Heedman, Å., Paxling, B., & Andersson, G. (2013). Depression, anxiety and their comorbidity in the Swedish general population: point prevalence and the effect on health-related quality of life. PeerJ, 1, e98-. https://doi.org/10.7717/peerj.98
Kocalevent, R.-D., Hinz, A., & Brähler, E. (2013). Standardization of the depression screener Patient Health Questionnaire (PHQ-9) in the general population. General Hospital Psychiatry, 35(5), 551–555. https://doi.org/10.1016/j.genhosppsych.2013.04.006
Kroenke, K., Spitzer, R. L., & Williams, J. B. W. (2001). The PHQ‐9. Journal of General Internal Medicine : JGIM, 16(9), 606–613. https://doi.org/10.1046/j.1525-1497.2001.016009606.x
Martin, A., Rief, W., Klaiberg, A., & Braehler, E. (2006). Validity of the Brief Patient Health Questionnaire Mood Scale (PHQ-9) in the general population. General Hospital Psychiatry, 28(1), 71–77. https://doi.org/10.1016/j.genhosppsych.2005.07.003
McMillan, D., Gilbody, S., & Richards, D. (2010). Defining successful treatment outcome in depression using the PHQ-9: A comparison of methods. Journal of Affective Disorders, 127(1), 122–129. https://doi.org/10.1016/j.jad.2010.04.030
Richardson, L. P., McCauley, E., Grossman, D. C., McCarty, C. A., Richards, J., Russo, J. E., Rockhill, C., & Katon, W. (2010). Evaluation of the Patient Health Questionnaire-9 Item for detecting major depression among adolescents. Pediatrics, 126(6), 1117-1123. https://doi.org/10.1542/peds.2010-0852
Urtasun, M., Daray, F. M., Teti, G. L., Coppolillo, F., Herlax, G., Saba, G., Rubinstein, A., Araya, R., & Irazola, V. (2019). Validation and calibration of the patient health questionnaire (PHQ-9) in Argentina. BMC Psychiatry, 19(1), 291–291. https://doi.org/10.1186/s12888-019-2262-9
NovoPsych’s mission is to help mental health services use psychometric science to improve client outcomes.
© 2023 Copyright – NovoPsych – All rights reserved