The SWAN assesses strengths and difficulties in attention and behavioural regulation in young people between 5 and 18 years of age and is typically rated by a parent.
The Strengths and Weaknesses of Attention-Deficit/Hyperactivity Disorder Symptoms and Normal Behavior Scale (SWAN) is an 18-item, parent, caregiver, or teacher-reported scale (Swanson et al., 2012). The SWAN is designed to assess strengths and difficulties in attention and behavioural regulation in children and adolescents under the age of 18 years. The items ask parents, caregivers, or teachers about a young person’s traits and behaviours based on DSM criteria for ADHD, yielding a score for two behavioural dimensions of ADHD:
Example SWAN Items
Unlike unidirectional ADHD assessments, which focus on assessing deficits and/or symptom severity, the SWAN assesses these dimensions as a continuum of behaviour ranging from strengths to difficulties, providing a comprehensive and balanced assessment of attention and behavioral regulation.
The SWAN can be used by a qualified professional, such as a psychologist, for initial screening for ADHD before or as part of comprehensive assessment. The SWAN alone is not sufficient to establish a diagnosis.
As the SWAN is completed by an informant rather than the client themselves, parent or teacher details can be added to the client file. Adding an informant can be done by following the steps outlined in the User Guide.
The SWAN consists of 18 items based on DSM criteria for ADHD, divided into two subscales:
Each item is rated on a 7-point scale (-3 to 3), ranging from Far Below Average (3, reflecting a difficulty) to Far Above Average (-3, reflecting a strength). Higher scores on the SWAN reflect greater difficulties, while lower scores reflect greater strengths.

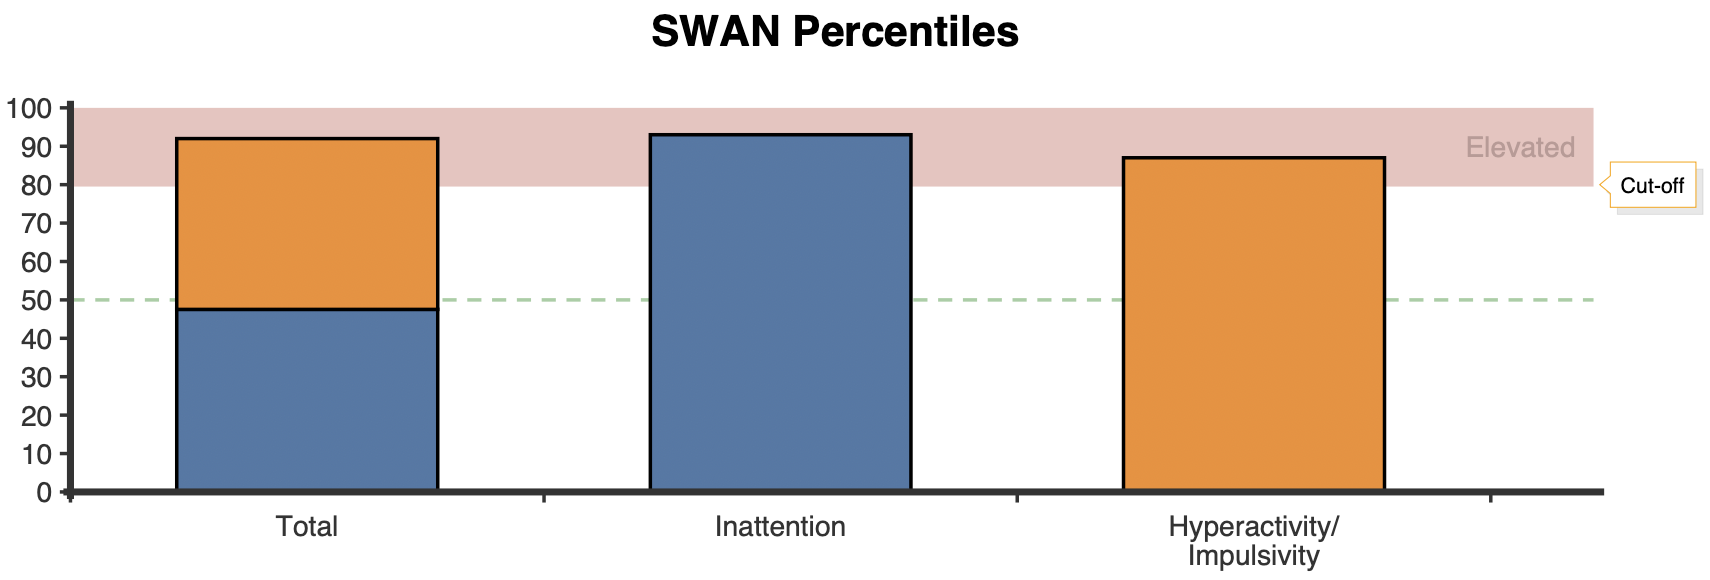
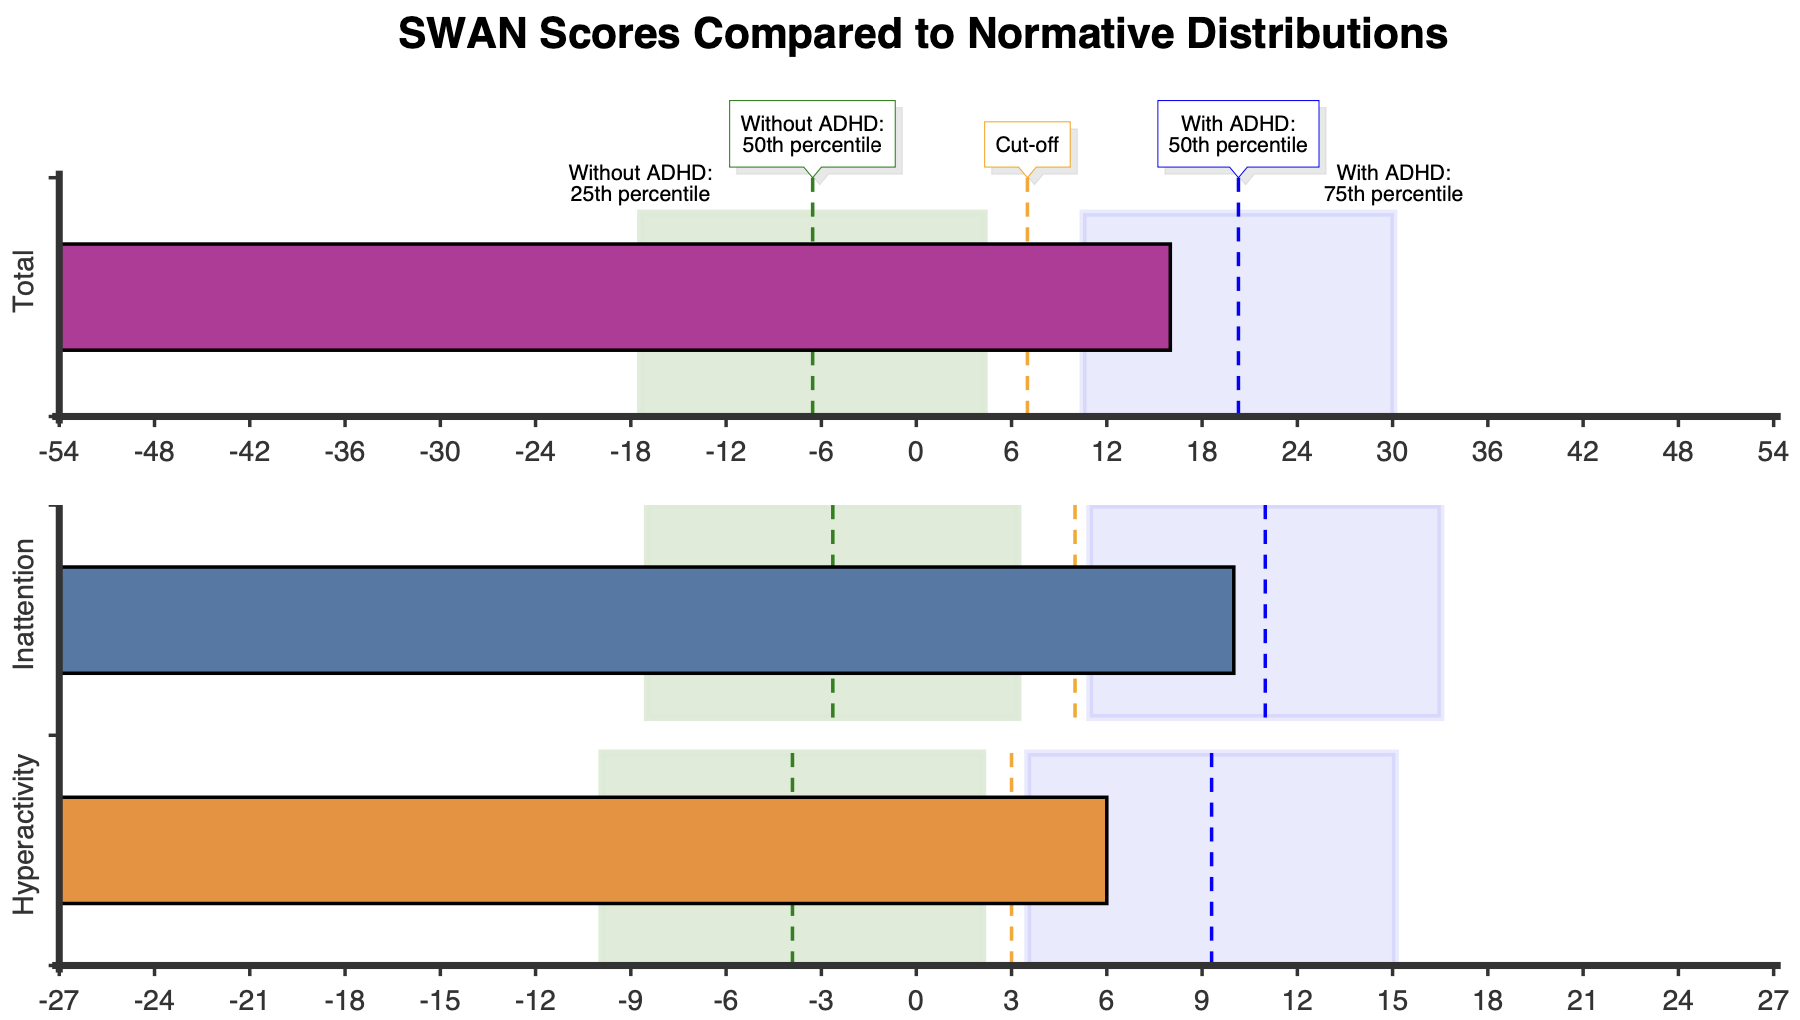
The client’s total and subscale scores are converted to percentiles based on normative data for a community sample of children and adolescents without ADHD and with ADHD (Burton et al., 2019). Graphs comparing the total and subscale scores to the normative distribution of scores among these samples are presented, with shaded areas around the means corresponding to scores between the 25th and 75th percentile. The percentiles and graphs contextualise the client’s scores relative to typical levels of strengths and difficulties in attention and behavioural regulation among young people with and without ADHD in the community.

Cut-off scores for elevated difficulties consistent with a diagnosis of ADHD are as follows (Burton et al., 2019).
Approximately 75-80% of young people without ADHD score below these cut-off scores, while about 80-85% of young people with ADHD score above these cut-off scores. Note that these cut-off scores are based on parent-reported ratings and may differ from cut-off scores based on teacher-reported ratings.

The SWAN can be used by a qualified professional, such as a psychologist, for initial screening for ADHD before or as part of comprehensive assessment. The SWAN alone is not sufficient to establish a diagnosis.
The SWAN has two factors and thus two subscales — Inattention and Hyperactivity/Impulsivity — reflecting the two-dimensional structure of the DSM conceptualisation of ADHD (Arnett et al., 2013; Swanson et al., 2012).
The SWAN total scale and subscales have high internal consistency (Cronbach’s alphas = .91 to .95) and moderate test-retest reliability over a 3-month interval (rs = .71 to .76) (Burton et al., 2019; Lakes et al., 2012).
SWAN scores are normally distributed in the general population and correlate with established measures of ADHD, while high scores converge with a diagnosis of ADHD (Burton et al., 2019; Crosbie et al., 2013; Swanson et al., 2012).
A community sample of children and adolescents without ADHD and with ADHD had the following total and subscale scores on the SWAN (Burton et al., 2019).
Without ADHD (n = 11,987 parents)
With ADHD (n = 810 parents)
The above means and SDs are used to convert the client’s scores to percentiles, providing useful information about their strengths and difficulties in attention and behavioural regulation relative to young people with and without ADHD in the community.
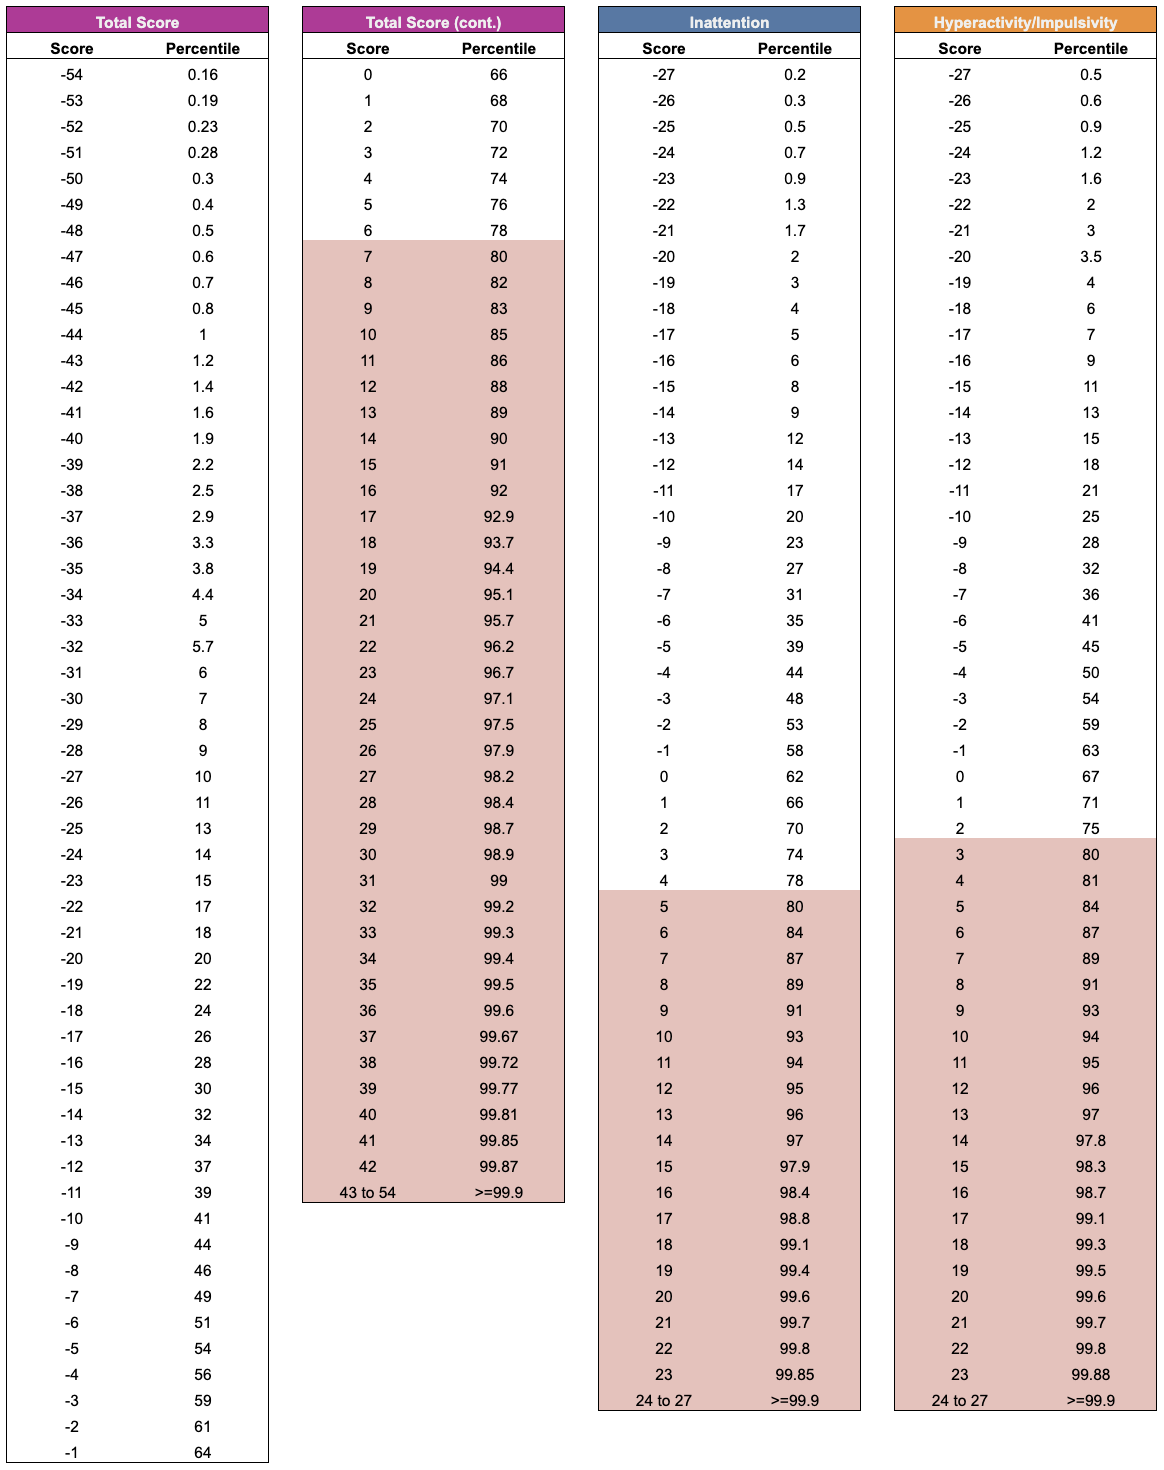
Percentiles for SWAN total and subscale scores are presented below. Each score has a corresponding percentile which indicates the percentage of people who scored the same as or lower than the given score. For example, a total score of 6 corresponds to the 78th percentile among children and adolescents without ADHD, indicating that 78% of the normative sample have a total score of 6 or lower. Scores indicative of elevated difficulties consistent with a diagnosis of ADHD are coloured red.

James M. Swanson
Arnett, A. B., Pennington, B. F., Friend, A., Willcutt, E. G., Byrne, B., Samuelsson, S., & Olson, R. K. (2013). The SWAN captures variance at the negative and positive ends of the ADHD symptom dimension. Journal of Attention Disorders, 17(2), 152-162. https://doi.org/10.1177/1087054711427399
Burton, C. L., Wright, L., Shan, J., Xiao, B., Dupuis, A., Goodale, T., Shaheen, S. M., Corfield, E. C., Arnold, P. D., Schachar, R. J., & Crosbie, J. (2019). SWAN scale for ADHD trait-based genetic research: A validity and polygenic risk study. Journal of Child Psychology and Psychiatry, and Allied Disciplines, 60(9), 988-997. https://doi.org/10.1111/jcpp.13032
Crosbie, J., Arnold, P., Paterson, A., Swanson, J., Dupuis, A., Li, X., Shan, J., Goodale, T., Tam, C., Strug, L. J., & Schachar, R. J. (2013). Response inhibition and ADHD traits: Correlates and heritability in a community sample. Journal of Abnormal Child Psychology, 41(3), 497-507. https://doi.org/10.1007/s10802-012-9693-9
Lakes, K. D., Swanson, J. M., & Riggs, M. (2012). The reliability and validity of the English and Spanish Strengths and Weaknesses of ADHD and Normal behavior rating scales in a preschool sample: Continuum measures of hyperactivity and inattention. Journal of Attention Disorders, 16(6), 510-516. https://doi.org/10.1177/1087054711413550
Swanson, J. M., Schuck, S., Porter, M. M., Carlson, C., Hartman, C. A., Sergeant, J. A., Clevenger, W., Wasdell, M., McCleary, R., Lakes, K., & Wigal, T. (2012). Categorical and dimensional definitions and evaluations of symptoms of ADHD: History of the SNAP and the SWAN rating scales. The International Journal of Educational and Psychological Assessment, 10(1), 51-70. https://www.ncbi.nlm.nih.gov/pmc/articles/PMC4618695/
NovoPsych’s mission is to help mental health services use psychometric science to improve client outcomes.
© 2023 Copyright – NovoPsych – All rights reserved