Everyone knows the K10 (Kessler Psychological Distress Scale). It’s routinely used by GPs referring to psychologists, but frankly, it is one of the bluntest instruments around. Measuring the broad concept of “psychological distress” doesn’t give much insight into someone’s mental state.
Thankfully, through the power of statistical analysis, NovoPsych has just made the K10 far more useful!
Instead of giving one number that is supposed to represent someone’s mental state, when administered via NovoPsych the K10 transforms into a scale that measures both Depression and Anxiety independently. In fact, the metrics go further than that, with the graph below showing that the main Depression and Anxiety factors are made up of four sub-components. To see the items that make up each K10 subscale visit here.
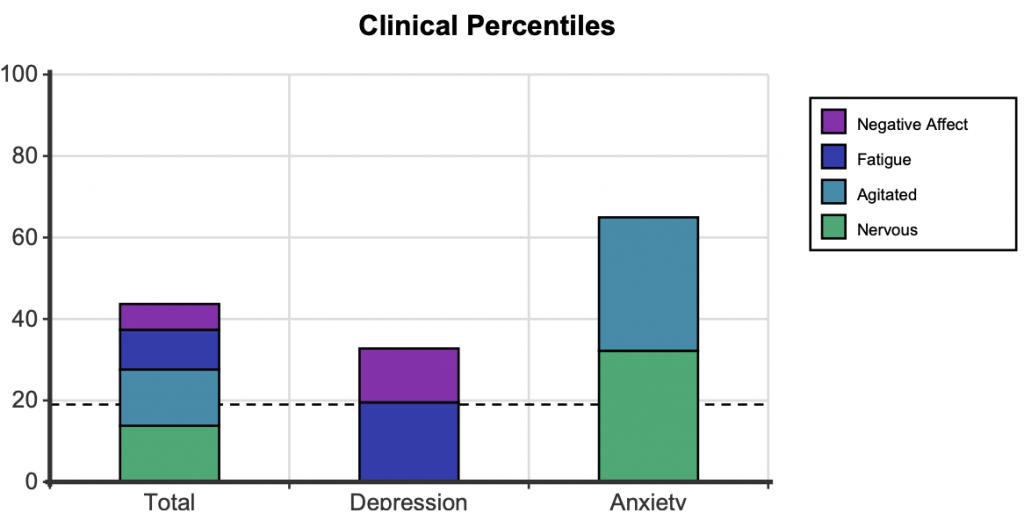
The above graph is computed by the NovoPsych platform from a standard K10 assessment, and clearly indicates that this individual is experiencing a great deal of Anxiety, with more moderate levels of Depression. The Y axis is from 0 to 100, and represents the percentile rank compared to other individuals seeking psychological intervention. For example, a percentile of 50 would represent the typical score for someone seeing a psychologist. Any scores above the dotted line at the 19th percentile indicate scores in the “clinical range”, while those below indicate no or minimal distress.
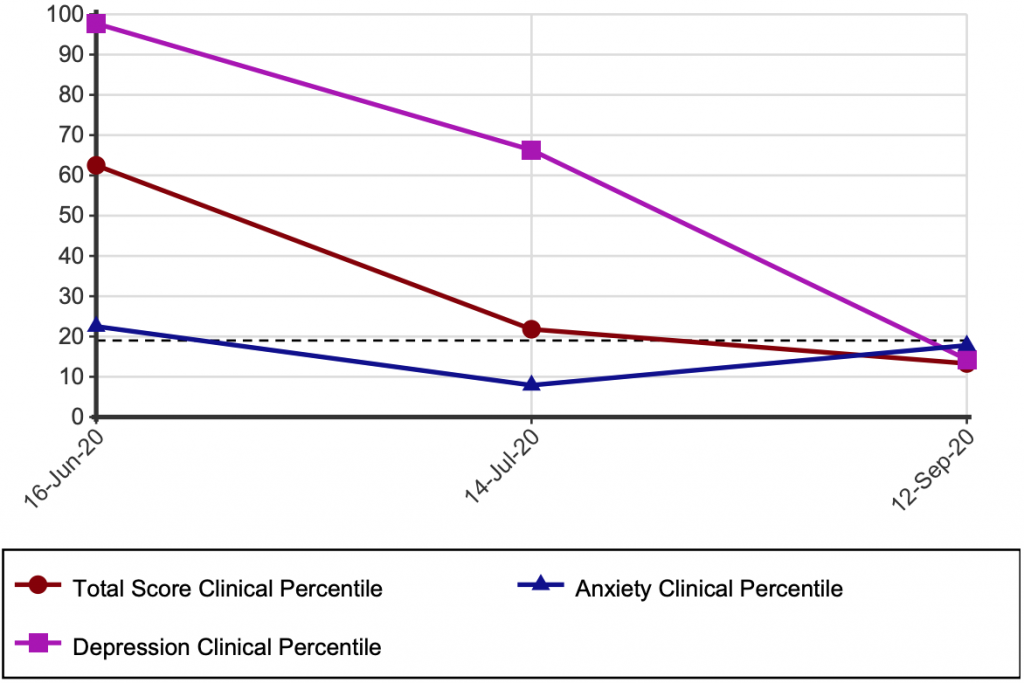
Of course one of the benefits of administering a scale like the K10 is that you can see changes in symptoms over time. For example, the below graph shows symptoms from the start to the end of treatment for a hypothetical client.
If you’d like more information about the research and development process that allowed us to break the K10 into two district symptom clusters, see here.
Before I go, a lot of NovoPsych users have requested the feature to re-date assessments. This might be useful in case you receive a referral from a GP with a K10 attached, and you want to enter the GP’s K10 into NovoPsych to keep the record and get NovoPsych’s useful metrics and graphs. I wanted to let you know that we’re working on it and will release that feature (and others) soon.